Stack and heap overflow detection at runtime via behavior analysis and Pin
by @Jonathan Salwan - 2013-10-14Recently I looked for how it was possible to detect a classical stack overflow at runtime. It's a really great subject with lot of interesting problematics - That's what we will see in this short post.
-
1 - Introduction
2 - Heap overflow detection
3 - Stack overflow detection
3.1 - Context
3.2 - Step 1 - Isolate the functions
3.3 - Step 2 - Know how many variables are instantiated in the stack frame
3.3.1 - Find the variables in the stack frame
3.3.2 - Find the size of variables
3.4 - Step 3 - Detect the loops which contain a STORE instruction to our stack frame
3.5 - Step 4 - Analyze the STORE to detect a potential overflow
3.6 - Proof of concept and demo
4 - Conclusion
1 - Introduction
The stack and heap overflow are in the same vulnerability family - With the same theory. However, if you want use pattern matching to detect one of these vulnerabilites, the methodology will be really different. The heap overflow detection is easier than the stack overflow detection. In the next chapters, we will talk about both approaches to show you that the stack overflow detection at runtime is a bit complicated but that's also the most interesting part.
2 - Heap overflow detection
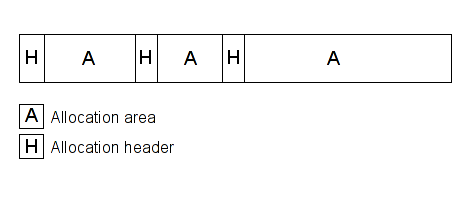
We will start with the heap overflow detection to show you how it's easy to detect an overflow in the heap at runtime. When you allocate an area in the heap, generally your memory allocator sets headers before or after (or both) your memory area. These headers can contain some information like size, used or not etc... Each header is specific to your allocator and its version. In a nutshell, your memory look like that:
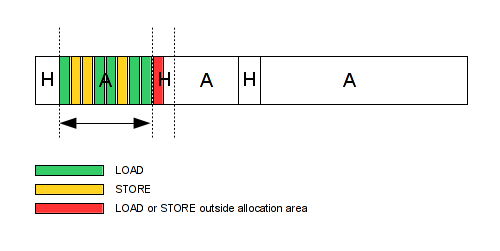
Basically, if you monitor your allocator, you can determine the base address and the size of your allocation areas. Then, if you check all STORE and LOAD accesses in memory, you can determine which one is outside your area. The following diagram, represents the memory and the STORE/LOAD access, the red one is the invalid access which is easy to detect at runtime via the STORE/LOAD analysis.
Let's see with a simple C code. The following code allocates two buffers with the same size and fills these areas in excess of 1 byte (Off-by-One).
#define BUFF_MAX 128

int main(int ac, const char *av[])
{
  char *buff1, *buff2;
  int i;

  buff1 = malloc(BUFF_MAX);
  buff2 = malloc(BUFF_MAX);
  if (!buff1 || !buff2)
    return -1;

  for (i = 0; i <= BUFF_MAX; i++) /* off-by-one */
    buff1[i] = 'A';

  for (i = 0; i <= BUFF_MAX; i++) /* off-by-one */
    buff2[i] = 'B';

  return 0;
}
Here, we can supervise all calls to the malloc function and save the base address and the size of our buffer in a std::list. Then, when a STORE or LOAD occurs, we just need to check if the destination address is in our list. If this is outside our area, we have probably an overflow.
$ ../../../pin -t ./obj-intel64/OverflowDetection.so -- ./test
[INFO] malloc(128) = 1270010
[INFO] malloc(128) = 12700a0
400636: mov byte ptr [rax], 0x41 -- Overflow in 1270090
400658: mov byte ptr [rax], 0x42 -- Overflow in 1270120
$
Same things with a C++ example. A private buffer is filled via a public method.
#define CONST_SIZE 32

class Test
{
  private:
    char *_buffer;

  public:
    Test(){
      this->_buffer = new char[CONST_SIZE];
    };

    ~Test(){
      delete [] this->_buffer;
    };

    void fillBuffer(void){
      unsigned int i;

      for (i = 0; i <= CONST_SIZE; i++) /* off-by-one */
        this->_buffer[i] = 'A';
    };
};

int main(int ac, const char *av[])
{
  Test test;
  test.fillBuffer();
  return 0;
}
And we have a similar result than the first one.
$ ../../../pin -t ./obj-intel64/OverflowDetection.so -- ./testcpp
[INFO] malloc(32) = 1632010
40081a: mov byte ptr [rax], 0x41 -- Overflow in 1632030
[INFO] free(1632010)
$
As you can see, detecting an heap overflow at runtime is really straightforward - In a simple case. Maybe you will ask you "Why does he talk about the heap overflow detection if it's straightforward to implement it". You are right, this chapter has just been written to show you that the methodology to detect a heap and stack overflow is really different.
3 - Stack overflow detection
3.1 - Context
Now let's see what it's possible to do about the stack overflow detection. We can't rely on the previous method due to several issues. First, if we consider that the memory area is a stack frame, we have not one but several variables in the same area. The main problem is to detect the overflow between these variables. Little example with the following code.
uint32_t a, b, c;

a = 0x11111111;
b = 0x22222222;
c = 0x33333333;

for (uint32_t i = 0; i <= sizeof(a); i++) /* of-by-one */
    *(((unsigned char *)(&a))+i) = 0xff;
This above code allocates three variables in the same stack frame. Then, we have a loop which fills the 'a' variable in excess of 1 byte (Off-by-one). Below the result of this operation.
a = ffffffff
b = 22222222
c = 333333ff
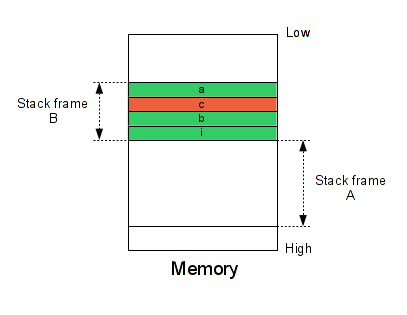
As you can see the 'a' variable is filled and the 'c' variable is corrupted. Maybe you will ask you, "Why 'c' not 'b'?". That depend on your compiler, here, my compiler sets the variable 'c' after the 'a' variable. But don't worry the methodology is still the same. Below our memory representation.
This problem will probably not crash the program, that's why it's possible to miss this type of vulnerabilities without a binary analysis. So, the main question is : How it's possible to detect the overflow between the variables at runtime without changing the code execution? I find this question very interesting because that's not so easy :-). For that, we need several steps:
- Isolate the functions.
- Know how many variables are instantiated in the stack frame.
- Detect the loops which contain a STORE instruction to our stack frame.
- Analyze this STORE to detect a potential overflow.
To be honest, the steps 1 and 3 are really straightforward. The real difficulties are for the step 2 and 4.
3.2 - Step 1 - Isolate the functions
We have several ways to isolate a function. Generally a function is called via the 'call' instruction and terminates via the "ret" instruction. This is not always true, but in our case, we can do that. In my PoC, I monitor all "call" and "ret" instructions and assign a unique ID for each stack frame. I don't assign an ID to the stack frames used by shared libraries. I monitor the text section only - This is just to avoid having too much data to manage. We have something like that:
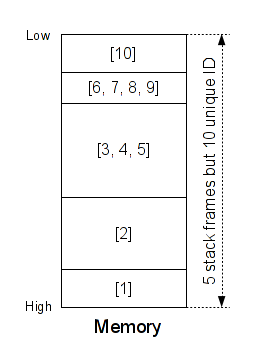
As you can see, at the instant T we have 5 stack frames but 10 unique ID. You can consider this assignation like the SSA form - To each new stack frame, we assign a new unique ID.
3.3 - Step 2 - Know how many variables are instantiated in the stack frame
3.3.1 - Find the variables in the stack frame
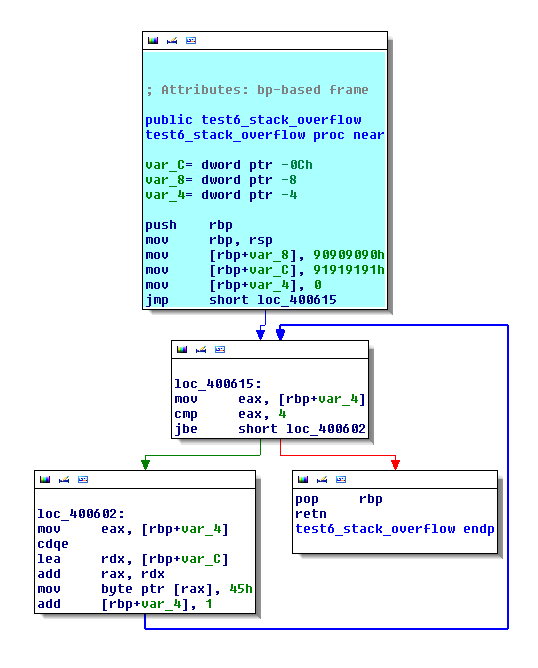
Now, we need to find how many variables are instantiated in a stack frame. This step is a little bit complicated but very interesting. As you already know, the variables are generally initialised just after the prologue and are in the first basic block in a function. For our first example, imagine the following code.
int a, b, i;

a = 0x90909090;
b = 0x91919191;

for (i = 0; i <= sizeof(b); i++) /* off-by-one */
  *(((unsigned char *)(&b))+i) = 'E';
The IDA view looks like that.
In the first step we arrive to isolate a function. Now, in this step we will isolate the STORE instruction to the stack frame. In my Pin tool, I have a std::list of stack frame which contains an unique ID and another std::list which contains all variables instantiated in this stack frame. For example, if I have three stack frames and the second stack frame contains three variables, I have something like that:
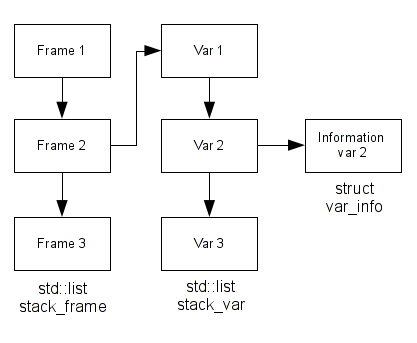
If we decide to visualize these structures with Pin on a simple code, we have something like this:
01. $ ../../../pin -t ./obj-intel64/OverflowDetection.so -- ./test
02. 4006d4: mov qword ptr [rbp-0x10], 0x0 (dest: 7fffdae70d10) (stack frame ID: 3)
03. 4006dc: mov qword ptr [rbp-0x18], 0x0 (dest: 7fffdae70d08) (stack frame ID: 3)
04. 4006e4: mov dword ptr [rbp-0x4], 0x0 (dest: 7fffdae70d1c) (stack frame ID: 3)
05. 40071f: mov dword ptr [rbp-0x4], 0x0 (dest: 7fffdae70d1c) (stack frame ID: 5)
06. 400742: mov dword ptr [rbp-0x4], 0x0 (dest: 7fffdae70d1c) (stack frame ID: 5)
07. 400640: mov dword ptr [rbp-0x4], 0x0 (dest: 7fffdae70cdc) (stack frame ID: 9)
08. 400669: mov dword ptr [rbp-0x8], 0x90909090 (dest: 7fffdae70cd8) (stack frame ID: 10)
09. 400670: mov dword ptr [rbp-0xc], 0x91919191 (dest: 7fffdae70cd4) (stack frame ID: 10)
10. 400677: mov dword ptr [rbp-0x4], 0x0 (dest: 7fffdae70cdc) (stack frame ID: 10)
11.
12. id stack frame: 3    Num var: 3
13. id stack frame: 5    Num var: 1
14. id stack frame: 9    Num var: 1
15. id stack frame: 10   Num var: 3
Maybe you have seen the lines 05 and 06, as you can see, we have two STORE but only one variable. This is not an error, in reality the stack frame 5 contains only one variable but this variable is initialised at two time. The code look like that:
uint32_t i;

...

for (i = 0; i <= 10; i++){
    ...
}

...

for (i = 0; i != 32; i++){
    ...
}
In a nutshell, we don't add a new element in our std::list stack_var if the destination address in the stack frame has already been initialised.
3.3.2 - Find the size of variables
This step is a little bit complicated... At this time, I'm still working still on it and it is far from being over. We can't use the pattern matching to know the size of a specific variable. Each compiler and each context will generate a different ASM code for the same C code. The stack frame management will be the same. The best way (I think), is to analyze the behavior of each variables (Value Set Analysis). In some specific case, we don't need to apply the VSA. Example with this following code.
void foo(void)
{
  int a, b, i;

  a = 0x90909090;
  b = 0x91919191;

  for (i = 0; i <= sizeof(b); i++) /* off-by-one */
    *(((unsigned char *)(&b))+i) = 'E';

  printf("a: %x\n", a);
  printf("b: %x\n", b);
}
The first basic block looks like that:
40055c:   push   rbp
40055d:   mov    rbp,rsp
400560:   sub    rsp,0x10
400564:   mov    DWORD PTR [rbp-0x8],0x90909090
40056b:   mov    DWORD PTR [rbp-0xc],0x91919191
400572:   mov    DWORD PTR [rbp-0x4],0x0
400579:   jmp    40058e <foo+0x32>
In this case, we can rely on the value of RSP/RBP and the address of variables to know their sizes.
$ ../../../pin -t ./obj-intel64/OverflowDetection.so -- ./test
4195684: mov dword ptr [rbp-0x8], 0x90909090
+---> (rsp: 7fff1fcf3280) (rbp: 7fff1fcf3290) (dest: 7fff1fcf3288) (stack frame ID: 3)

4195691: mov dword ptr [rbp-0xc], 0x91919191
+---> (rsp: 7fff1fcf3280) (rbp: 7fff1fcf3290) (dest: 7fff1fcf3284) (stack frame ID: 3)

4195698: mov dword ptr [rbp-0x4], 0x0
+---> (rsp: 7fff1fcf3280) (rbp: 7fff1fcf3290) (dest: 7fff1fcf328c) (stack frame ID: 3)

a: 90909045
b: 45454545
id stack frame: 3 -- Num var: 3 ( 7fff1fcf3284:4 7fff1fcf3288:4 7fff1fcf328c:4 )
But in several cases it's more complicated, like in this case:
int foo(int a, char *p)
{
    char        buf[32];
    uint32_t    i;
    ...
}
Maybe I will write another post about this part because we can say lot of interesting things.
3.4 - Step 3 - Detect the loops which contain a STORE instruction to our stack frame
To detect the loops, I've chosen to count the number of instruction executed and analyze the trace. It's probably not the best solution but for simple tests this is enough.
uint32_t a, b, c;

a = 0x11111111;
b = 0x22222222;
c = 0x33333333;

for (uint32_t i = 0; i <= sizeof(a); i++) /* of-by-one */
    *(((unsigned char *)(&a))+i) = 0x2e;
For example, with this above loop, the call trace look like that:
Addr    Nb  Inst
4004e4  1   push rbp
4004e5  1   mov rbp, rsp
4004e8  1   mov dword ptr [rbp-0x14], edi
4004eb  1   mov qword ptr [rbp-0x20], rsi
4004ef  1   mov dword ptr [rbp-0x10], 0x11111111
4004f6  1   mov dword ptr [rbp-0x8], 0x22222222
4004fd  1   mov dword ptr [rbp-0xc], 0x33333333
400504  1   mov dword ptr [rbp-0x4], 0x0
40050b  1   jmp 0x40051e
40050d  5   mov eax, dword ptr [rbp-0x4]
400510  5   lea rdx, ptr [rbp-0x10]
400514  5   add rax, rdx
400517  5   mov byte ptr [rax], 0x2e
40051a  5   add dword ptr [rbp-0x4], 0x1
40051e  6   cmp dword ptr [rbp-0x4], 0x4
400522  6   jbe 0x40050d
400524  1   mov eax, 0x0
400529  1   pop rbp
40052a  1   ret
If we visualize this execution flow with a diagram, we have something like that:
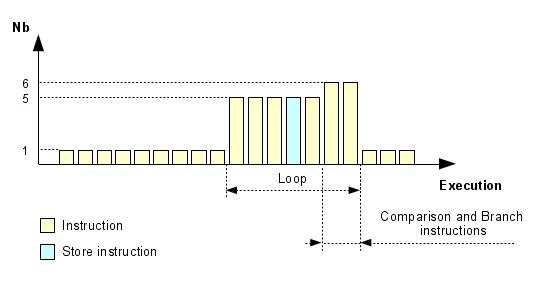
As you can see, we can easier show the loop. Generally a loop ends with a conditional jump. However, this method doesn't work if the loop was taken only one time but this case does not interest us. Here, we need to find the loops which contain a STORE instruction on our stack frame.
3.5 - Step 4 - Analyze the STORE to detect a potential overflow
Now, for each loops, we need to analyze the STORE instruction. If a STORE instruction occurs, we check where the value is stored. If the value destination is in our stack frame, we monitor that for each STORE the value is stored in the same area. Example with the same above code:
Addr    Nb  Inst
4004e4  1   push rbp
4004e5  1   mov rbp, rsp
4004e8  1   mov dword ptr [rbp-0x14], edi
4004eb  1   mov qword ptr [rbp-0x20], rsi
4004ef  1   mov dword ptr [rbp-0x10], 0x11111111
4004f6  1   mov dword ptr [rbp-0x8], 0x22222222
4004fd  1   mov dword ptr [rbp-0xc], 0x33333333
400504  1   mov dword ptr [rbp-0x4], 0x0
40050b  1   jmp 0x40051e
40050d  5   mov eax, dword ptr [rbp-0x4]
40050d  1     -> STORE in 0x7fffffffdc10
40050d  1     -> STORE in 0x7fffffffdc11
40050d  1     -> STORE in 0x7fffffffdc12
40050d  1     -> STORE in 0x7fffffffdc13
40050d  1     -> STORE in 0x7fffffffdc14
400510  5   lea rdx, ptr [rbp-0x10]
400514  5   add rax, rdx
400517  5   mov byte ptr [rax], 0x2e
40051a  5   add dword ptr [rbp-0x4], 0x1
40051e  6   cmp dword ptr [rbp-0x4], 0x4
400522  6   jbe 0x40050d
400524  1   mov eax, 0x0
400529  1   pop rbp
40052a  1   ret
If we visualize this execution flow with a diagram, we have something like that:
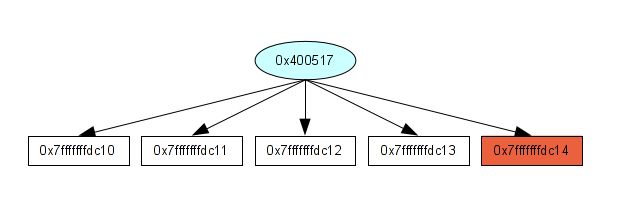
As we know, with the previous step, we know the size of 0x7fffffffdc10 (int a) which is 4 bytes. So, if we have 5 linear STORE instructions in the same loop to this base address, we can have a potential overflow. I know this is not always true but as you already know, I like to play with different things and experiment by myself which ones are the best. This method is clearly not the best. I saw lot of false positives which can match. Like that:
struct test_s {
    int a, b, c;
};

int foo()
{
    struct test_s test;
    memset(&test, 0x00, sizeof(struct test_s));
}
This memset tricks is often used. This is clearly an overflow, but an overflow controlled :).
3.6 - Proof of concept and demo
Now, let's see what I can catch with this method. See the following test code.
#include <stdio.h>
#include <stdlib.h>
#include <string.h>

#define BUFF_MAX 32

void test4_heap_overflow(char *buff1)
{
  /* 5 bytes overwritten outside the area "42 42 42 42 00" */
  strcpy(buff1, "AAAAAAAAAAAAAAAAAAAAAAAAAAAAAAAABBBB");
}

void test5_stack_overflow(void)
{
  int a, b, i;

  a = 0x90909090;
  b = 0x91919191;

  for (i = 0; i <= sizeof(b); i++)
    *(((unsigned char *)(&b))+i) = 'E';

}

int main(int ac, const char *av[])
{
  char *buff1 = NULL, *buff2 = NULL;
  int i = 0;

  buff1 = malloc(BUFF_MAX);
  buff2 = malloc(BUFF_MAX);
  if (!buff1 || !buff2)
    return -1;

  /* Test 1 - heap overflow (off-by-one) */
  for (i = 0; i <= BUFF_MAX; i++)
    buff1[i] = 'A';

  /* Test 2 - heap overflow (off-by-one) - Via linear buffer buff1->buff2 */
  for (i = 0; i <= BUFF_MAX; i++)
    buff2[i] = 'B';

  /* Test 3 - Use after free */
  free(buff1);
  buff1[16] = 'C';          /* Will match */
  buff1 = malloc(BUFF_MAX);
  buff1[16] = 'C';          /* Will not match */

  /* Test 4 - Classical Heap overflow */
  test4_heap_overflow(buff1);

  /* Test 5 - Stack overclow */
  test5_stack_overflow();

  return 0;
}
My Pin tool output is :
$ ../../../pin -t ./obj-intel64/OverflowDetection.so -- ./test
400694: mov byte ptr [rax], 0x41 -- Heap overflow in 2250030
4006b7: mov byte ptr [rax], 0x42 -- Heap overflow in 2250060
4006d8: mov byte ptr [rax], 0x43 -- Use after free in 2250020
4005df: mov dword ptr [rax+0x20], 0x42424242 -- Heap overflow in 2250030
4005e6: mov byte ptr [rax+0x24], 0x0 -- Heap overflow in 2250034
400613: mov byte ptr [rax], 0x45 -- Stack overflow in 7fff49349558
$
As you can see, I also added the use-after-free detection, this method is written in a previous post.
4 - Conclusion
This short post tried to show you the different ways to detect the stack and heap overflow and as you can see the methodology is really different. I know that the approach to the stack overflow detection is not the best and that it is not reliable but it was interesting to study. Now if I need to detect a stack overflow in a real research project, I will not use this approach. Maybe to work directly on the intermediate representation will be more easier - Like memcheck on Valgrind. The most interesting part was to the stack frame analysis, how many variables were instantiated and their sizes. I will not release my Pin tool because it's clearly not a serious project and my tool does not deserve to be published. However, if you are really interested in it, I can send it by email.
Edit 2014-01-21: Since this blog post has been released, I received a lot of emails asking me if I could send or publish my sources. I have sent it to every person who asked me, but I won't keep the sources indefinitely on my laptop, that's why finally I decided to release them. You may ask why I didn't release them? I consider them really not reliable, they are really specific to my examples. You've been warned that you may have to modify a lot the sources if you want to adapt them to your project :-). Anyway I hope these sources will help some people :-).